
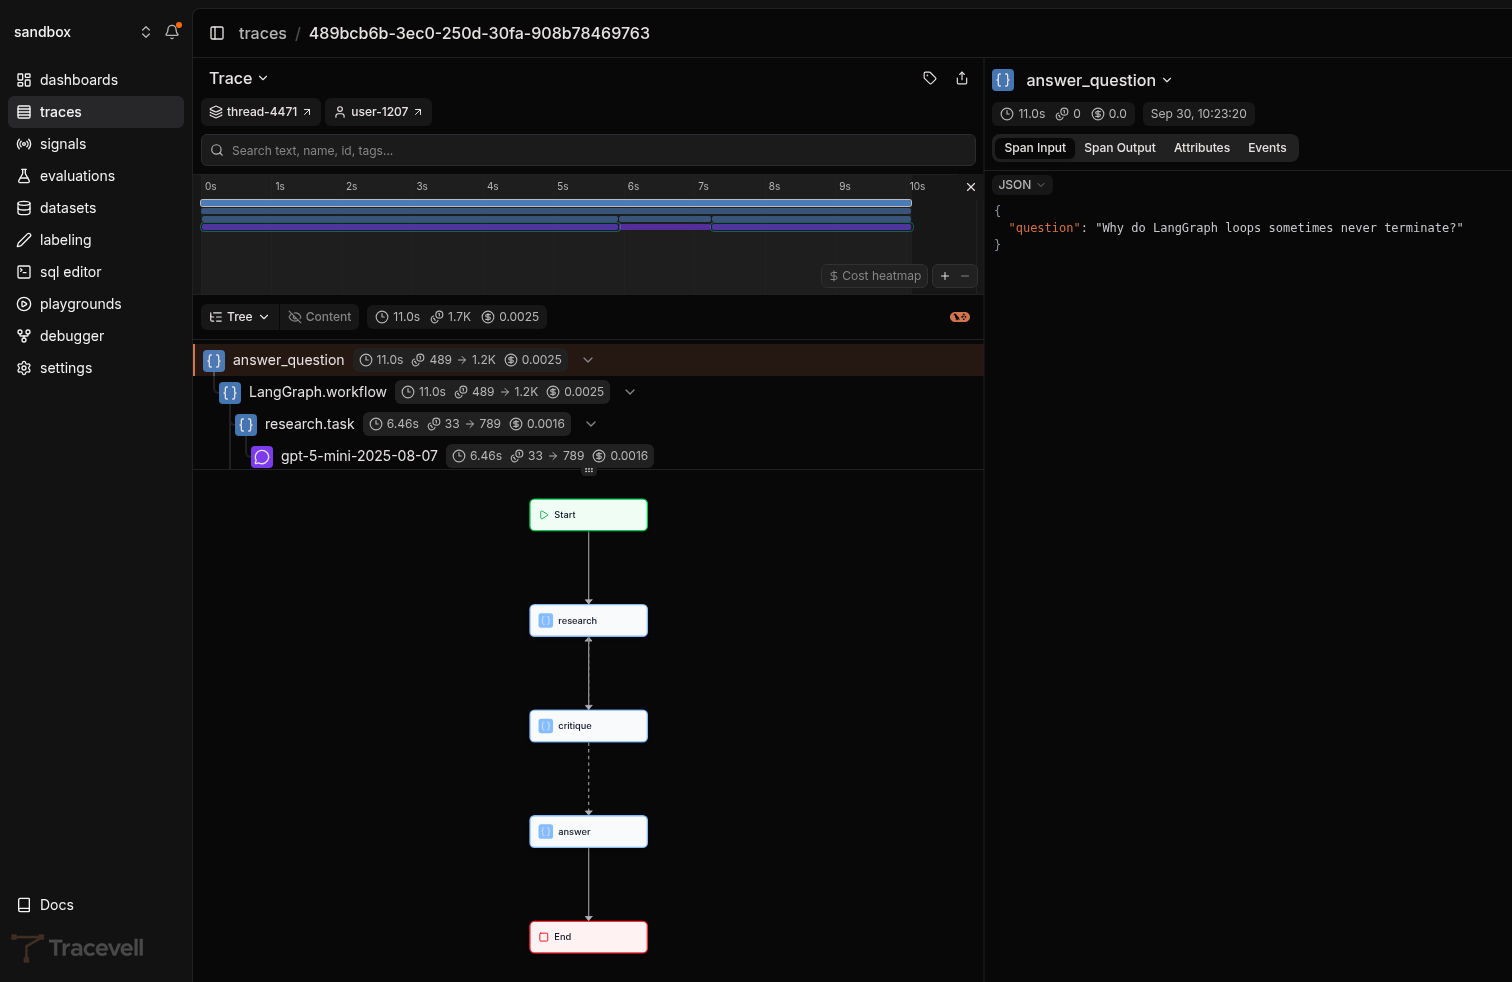
Set up
Graph visualization comes with the LangChain and LangGraph integration. There’s nothing to add to your graph code.- TypeScript
- Python
Pass the Without
@langchain/langgraph module as langgraphModule, next to the other LangChain modules in instrumentModules:instrumentation.ts
langgraphModule, the graph’s runs are still traced, but the trace has no graph to show.What the trace contains
- The graph is recorded on the run’s root span, so a trace has one graph view. A subgraph run inside a node doesn’t replace the outer graph.
- Every node that runs is an
execute_task <node>span under the graph’s root, with its input and output state, so the graph view and the span list describe the same run. - Tool calls and LLM calls made inside a node nest under that node’s span. See What Tracevell records for the full span list.